
The Main Dashboard
The Main Dashboard is where you start your day in EasyReports. It shows your invoices, your stock at the warehouse and your open requests at a glance, and on Lite and Pro it adds today’s Amazon figures.
A quick look at the Main Dashboard: the warehouse widgets at the top, then the Amazon figures below.
Open the Main Dashboard
Section titled “Open the Main Dashboard”- Sign in to EasyReports. You land on the Main Dashboard.
- From anywhere else in the app, click the EasyReports logo to get back to it.
Read the Invoices, Warehouse Stock and Operations widgets
Section titled “Read the Invoices, Warehouse Stock and Operations widgets”The top of the Main Dashboard has three widgets. Every tile opens its own page, and View all → opens the full list.
- Invoices: Unpaid invoices (how many) and Outstanding balance (how much). See Invoices.
- Warehouse Stock: Total in stock, Critical (≤5) for products with five cartons or fewer, Out of stock, and Storage cost · MTD, your storage cost so far this month. See Stock and Billing breakdown.
- Operations: Replenishments on their way to Amazon, plus your open Orders, Shipping quotes, Outbound orders and Custom jobs.
Anything that needs your attention is coloured, for example unpaid invoices or products that are out of stock. Click the tile to deal with it.
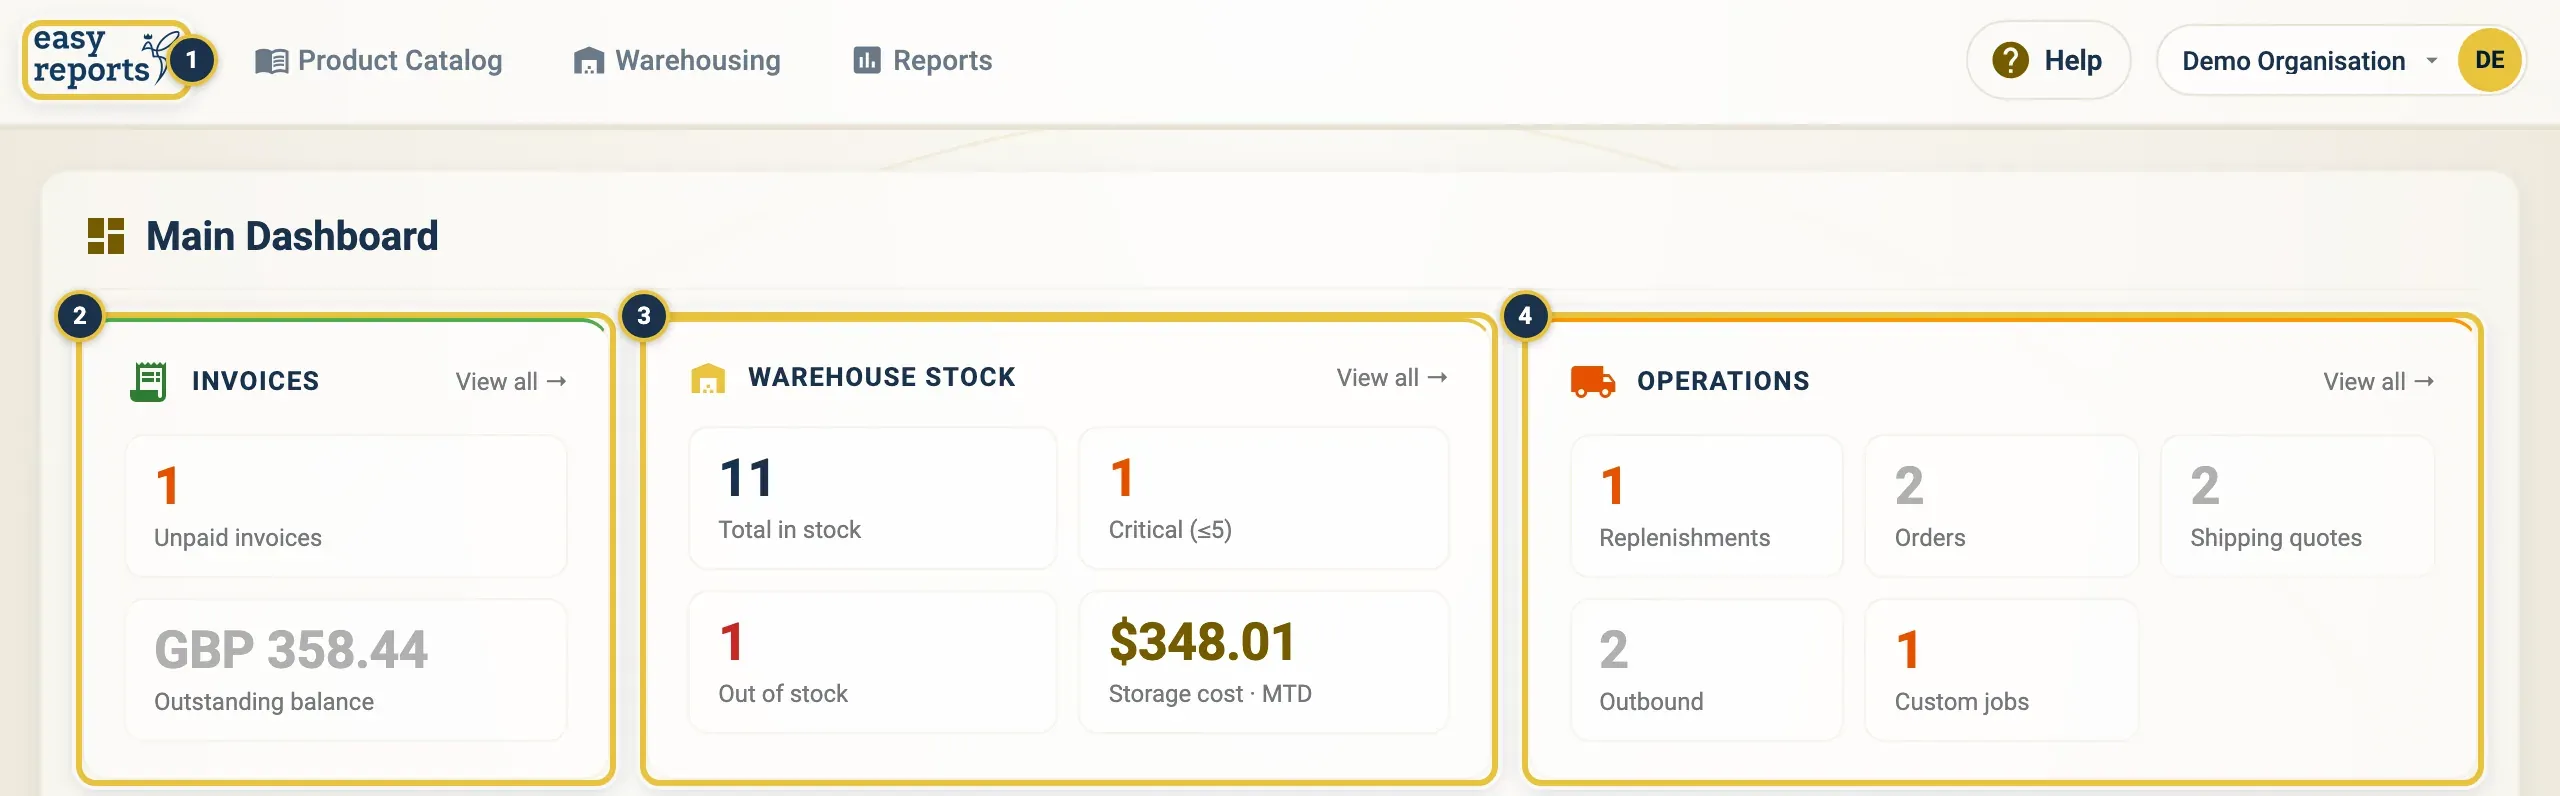
The logo (1) always brings you back here. Below it: Invoices (2), Warehouse Stock (3) and Operations (4).
Check today’s Amazon figures (Lite and Pro)
Section titled “Check today’s Amazon figures (Lite and Pro)”With Amazon connected on Lite or Pro, the Amazon widget on the Main Dashboard shows a Today row:
- Units and Orders: what was ordered today (UTC), across all your marketplaces.
- Open orders: paid orders waiting to be shipped, from the last 60 days.
- Awaiting payment: orders Amazon has not yet authorised for payment.
- Restock alerts: FBA items below their restock level. This tile is marked as coming soon.
- Buy Box held: how often you held the Buy Box, from the latest 14-day Sales & Traffic data.

Units and Orders (1), Open orders (2), Awaiting payment (3), Restock alerts (4) and Buy Box held (5).
Hover over the small info icon next to a tile for its exact meaning. The header shows when the data was last synced.
If Amazon is not connected yet, the widget shows a Connect Amazon button instead. See Connect Amazon.
See last month’s performance (Pro)
Section titled “See last month’s performance (Pro)”On Pro, the Amazon widget on the Main Dashboard also has a Performance row for the latest month with data. The month is shown next to the title, for example Performance · 2026-10:
- Net revenue, Ad spend (with ROAS), Profit margin, Conversion (with sessions) and TACoS (with ACoS), each compared with the month before where available.
- A Monthly sales & sessions chart.
- Top SKUs · Last 30 Days, your best-selling products. All SKUs → opens the Product Catalog.
Money is shown in your reporting currency. Click the currency code next to the row title to change it in Organization settings.
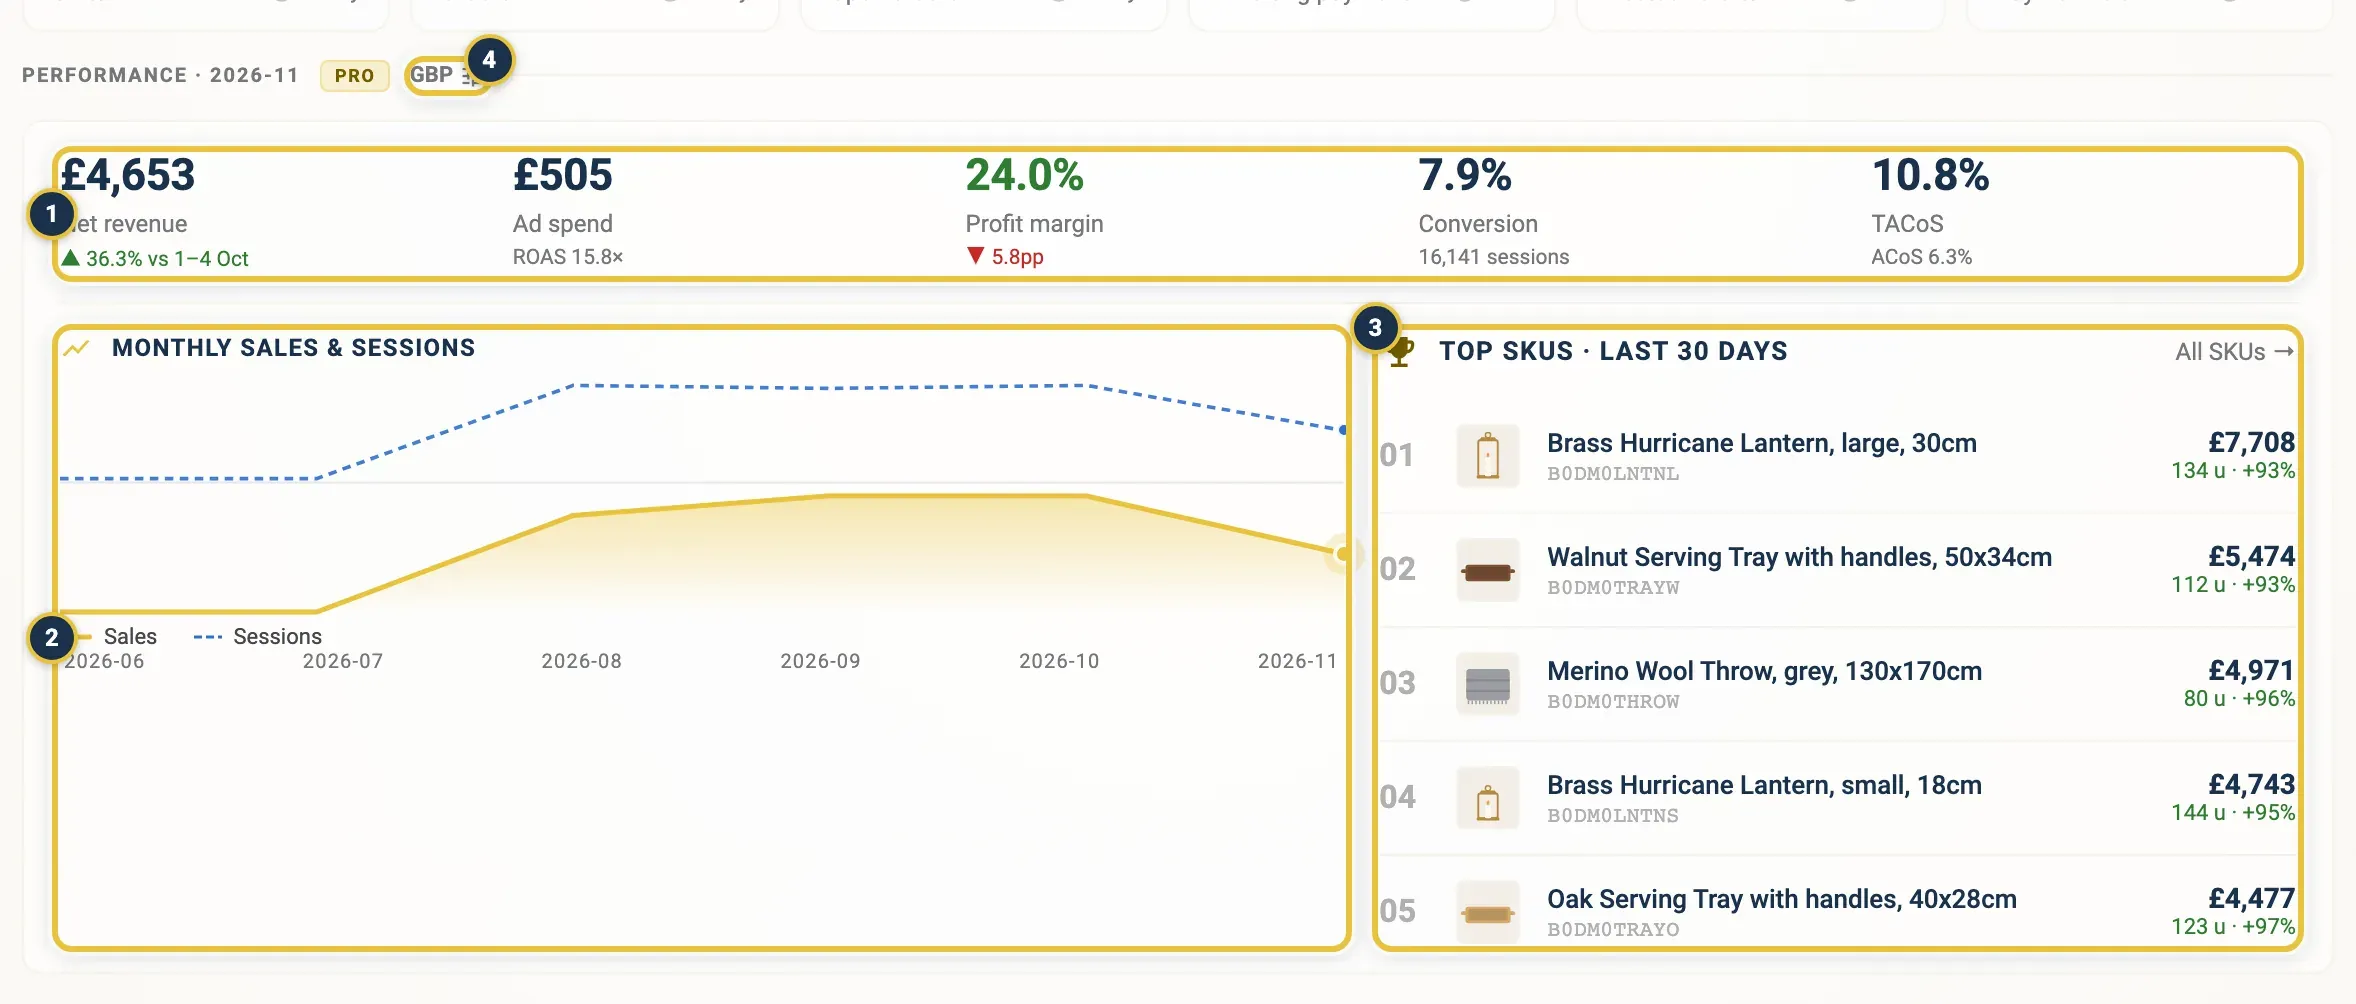
The month’s figures (1), the Monthly sales & sessions chart (2), Top SKUs · Last 30 Days (3) and the reporting currency link (4).
Good to know
Section titled “Good to know”- On Lite, the Performance row is shown dimmed with an Upgrade → link: the sales chart, ad spend and ROAS come with Pro.
- On Free, the Amazon widget is a preview with an Upgrade button. See Your subscription and plans.
- Running low on a product? See Running low: restock.