

Sales & Traffic
Sales & Traffic shows, for one product in one Amazon market, whether visits to your listing turn into sales. EasyReports brings in Amazon’s data for each product and marketplace, and groups it into 14-day periods. It is part of the Lite and Pro plans.
Open Sales & Traffic for a product
Section titled “Open Sales & Traffic for a product”- Click Reports in the top menu, then Sales & Traffic.
- Click the product chip and select a product.
- Click the Market chip and pick a country.
- Use the Date chip to choose the date range.
Use the Archived chip to include archived products in the product list.
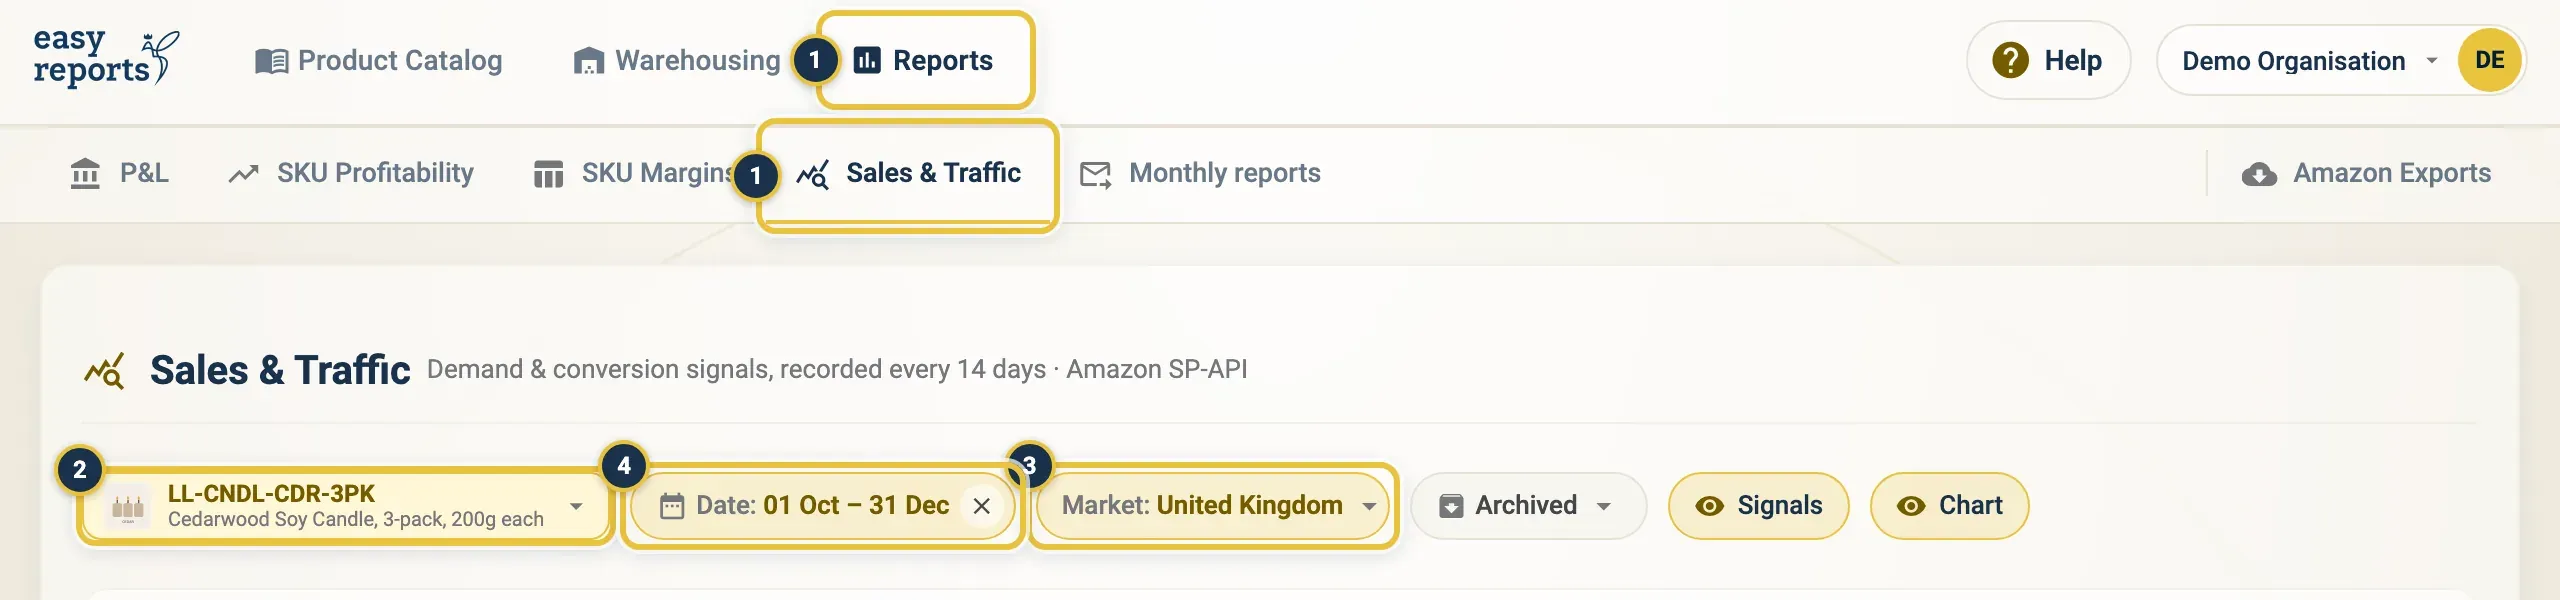
Reports, then Sales & Traffic (1), the product chip (2), the Market chip (3) and the Date chip (4).
Read the Sales & Traffic signals
Section titled “Read the Sales & Traffic signals”The Signals strip on Sales & Traffic reads the data for you:
- Conversion: the share of sessions that turn into orders (unit-session %, or USP). Below 8% is low; above 18% is strong and may leave room for a higher price.
- Visibility: sessions per period, and whether traffic is rising, falling or flat.
- Multi-pack: how many orders are for a single unit. If almost all are, a multi-pack may lift units per order.
- Peak period: the period with the highest demand.
- Replenish: roughly how many units you need to cover the next two periods at current demand.
Click Signals in the filter row to hide or show the strip.
Use the Sales & Traffic timeline
Section titled “Use the Sales & Traffic timeline”The Performance timeline plots units ordered against sessions, with the conversion rate (USP) on top.
- Click the split button to show sessions as Organic and PPC.
- Click the USP button to show or hide the conversion line.
- Click Chart in the filter row to hide or show the whole chart.
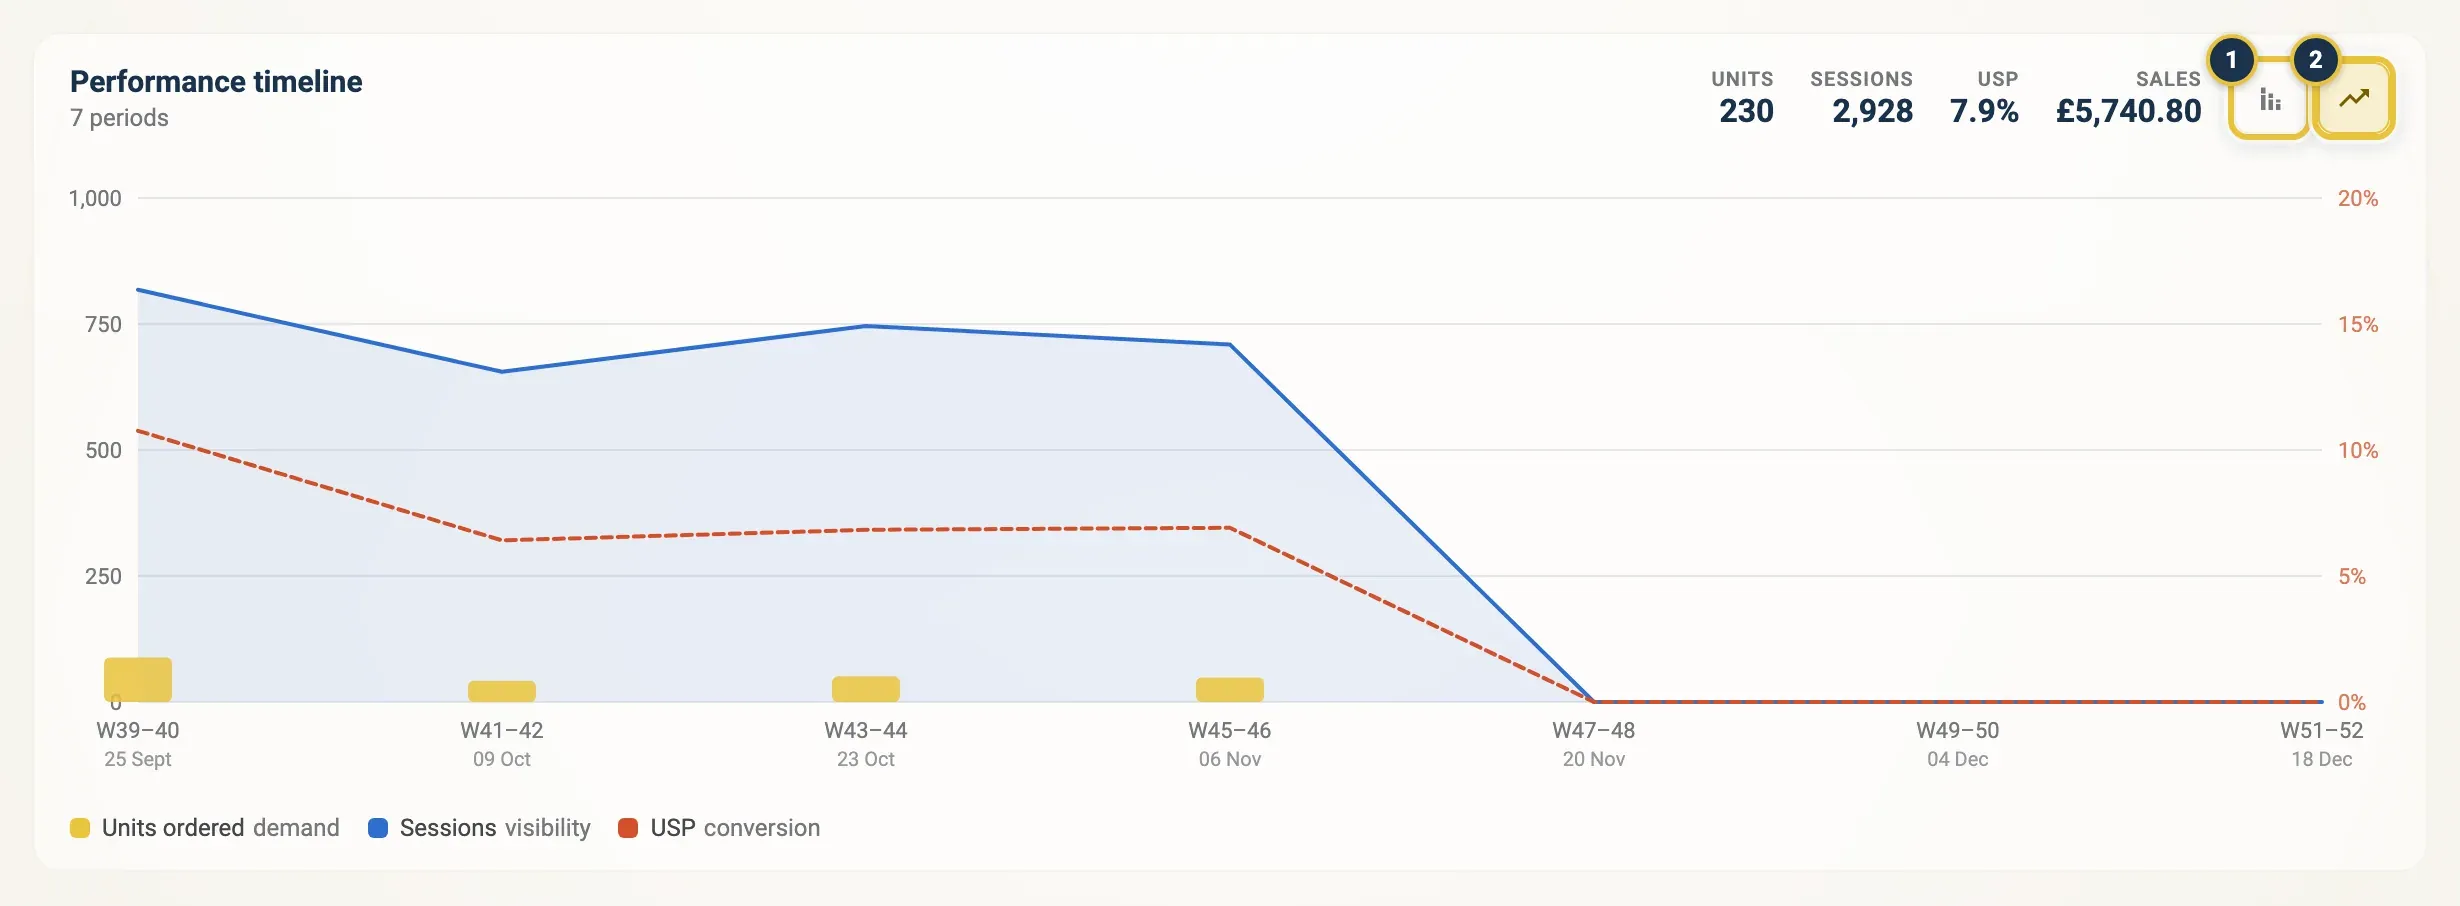
The split button (1) and the USP button (2) beside the Performance timeline.
Add a note to a Sales & Traffic period
Section titled “Add a note to a Sales & Traffic period”Every period is listed below the chart, with sessions, page views, buy box, units, USP, product sales, order items and PPC spend. Add a note so you remember what changed.
- Click a period in the list.
- The side panel shows the full figures for that period.
- Type in Note, for example a price change, a listing edit, a stock-out or a promotion.
- Click Save note.
- Use the arrows at the top of the panel to move to the previous or next period.
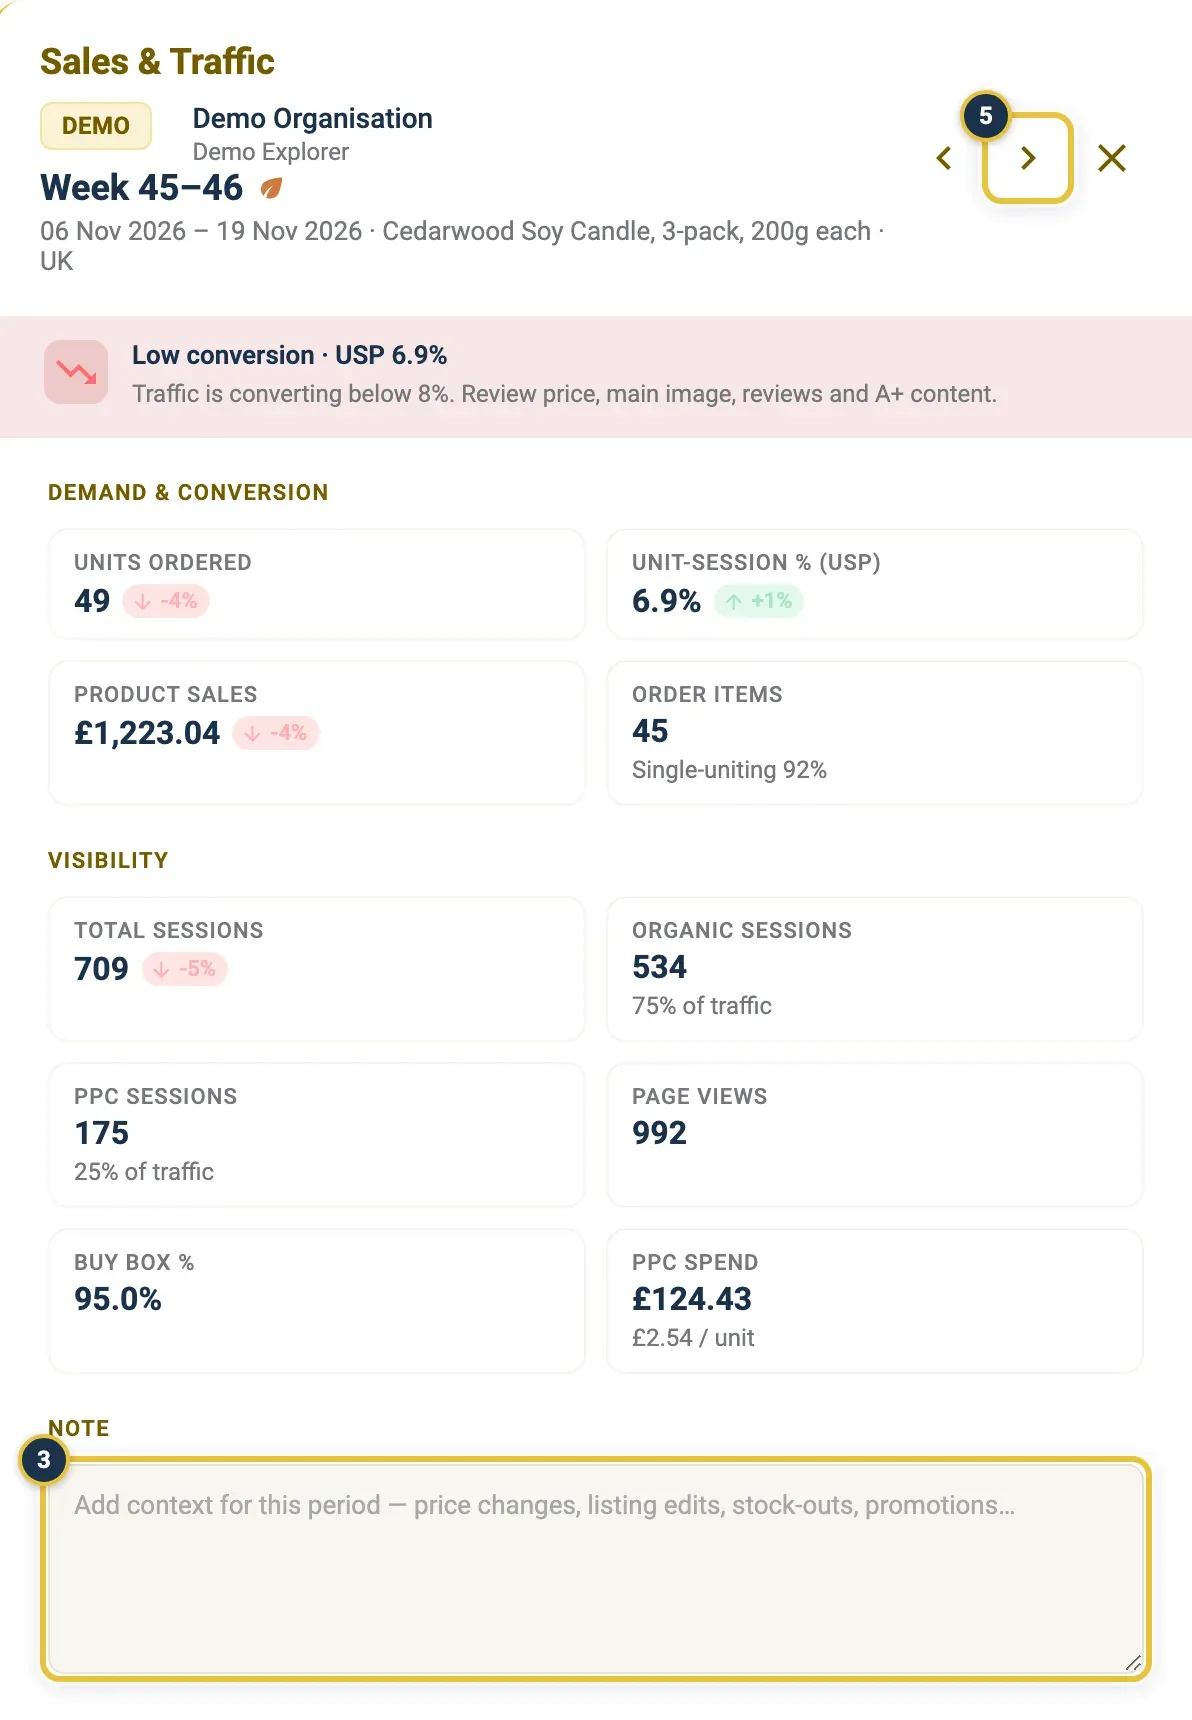
One period in the side panel: type in Note (3), and use the arrows (5) to move between periods. Save note is at the bottom of the panel.
Split sessions, toggle USP, then open a period and step back to the one before.
A note icon in the list shows which periods have a note. Hover over it to read the note.
Good to know
Section titled “Good to know”- Sales & Traffic follows one product at a time. If you have no products yet, add them in the Product Catalog.
- Data arrives once your Amazon account is connected. See Connect Amazon.
- Use the Replenish signal as a guide when you plan a replenishment.