

SKU Profitability
SKU Profitability goes through every selling SKU, line by line, for one marketplace and one month: revenue, fees, landed cost, PPC, storage and net profit. Each SKU gets a status, so you can see at a glance where to act. It is part of the Pro plan.
Open SKU Profitability for a marketplace and month
Section titled “Open SKU Profitability for a marketplace and month”- Click Reports in the top menu, then SKU Profitability.
- Click the month chip and pick a month.
- Click the Marketplace chip and pick one country.
The line above the table shows how many selling SKUs there are for that marketplace and month.
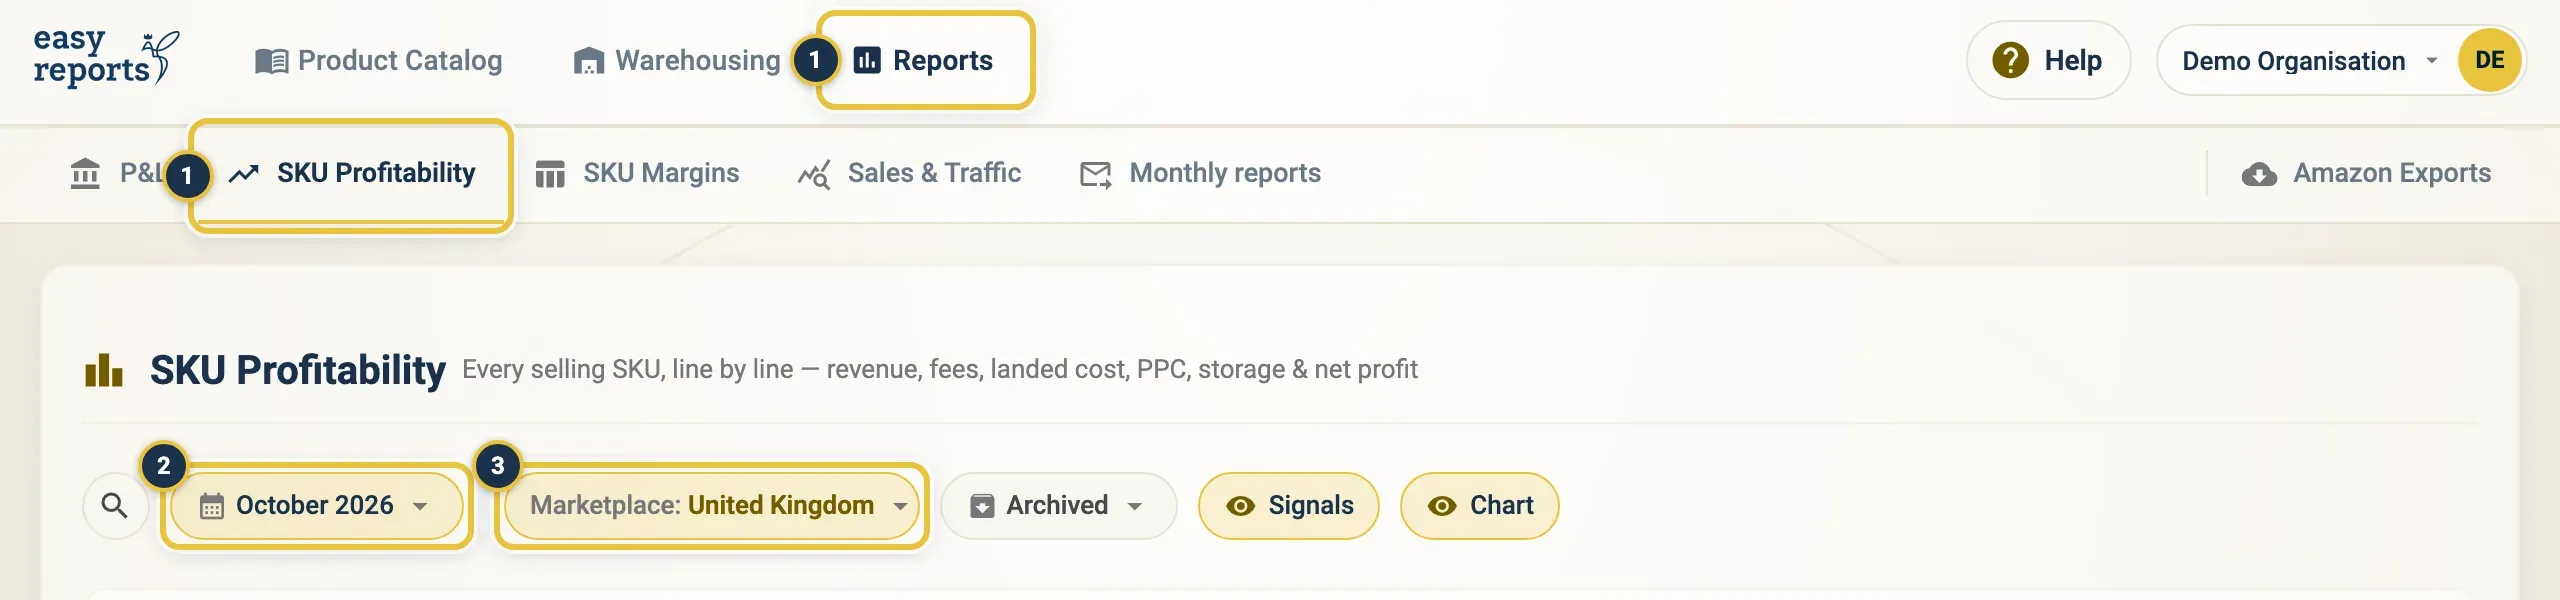
Reports, then SKU Profitability (1), the month chip (2) and the Marketplace chip (3).
Read the SKU Profitability signals
Section titled “Read the SKU Profitability signals”The Signals strip at the top of SKU Profitability sums up the month:
- Portfolio margin: your net profit as a share of revenue, across all SKUs.
- Top contributor: the SKU that made the most net profit.
- Biggest drag: the SKU with the lowest net profit, or the biggest loss.
- PPC bleed: how many SKUs spend 18% or more of their revenue on ads.
- Margin watch: how many SKUs lose money, or have a thin margin under 8%.
Click Signals in the filter row to hide or show the strip.
Use the Portfolio P&L chart
Section titled “Use the Portfolio P&L chart”The Portfolio P&L chart on SKU Profitability shows where your revenue goes: referral and FBA fees, landed cost, PPC and storage, down to net profit. The tiles beside it show Revenue (after refunds), Refunds, Refund %, Net profit, Margin and the number of SKUs.
- Use the buttons beside the chart to switch between Cost stack bar, Top contributors and Margin map.
- Under the cost stack bar, Start here · problem SKUs, worst first lists the SKUs that need attention. Click one to open it.
- Click Chart in the filter row to hide or show the chart.
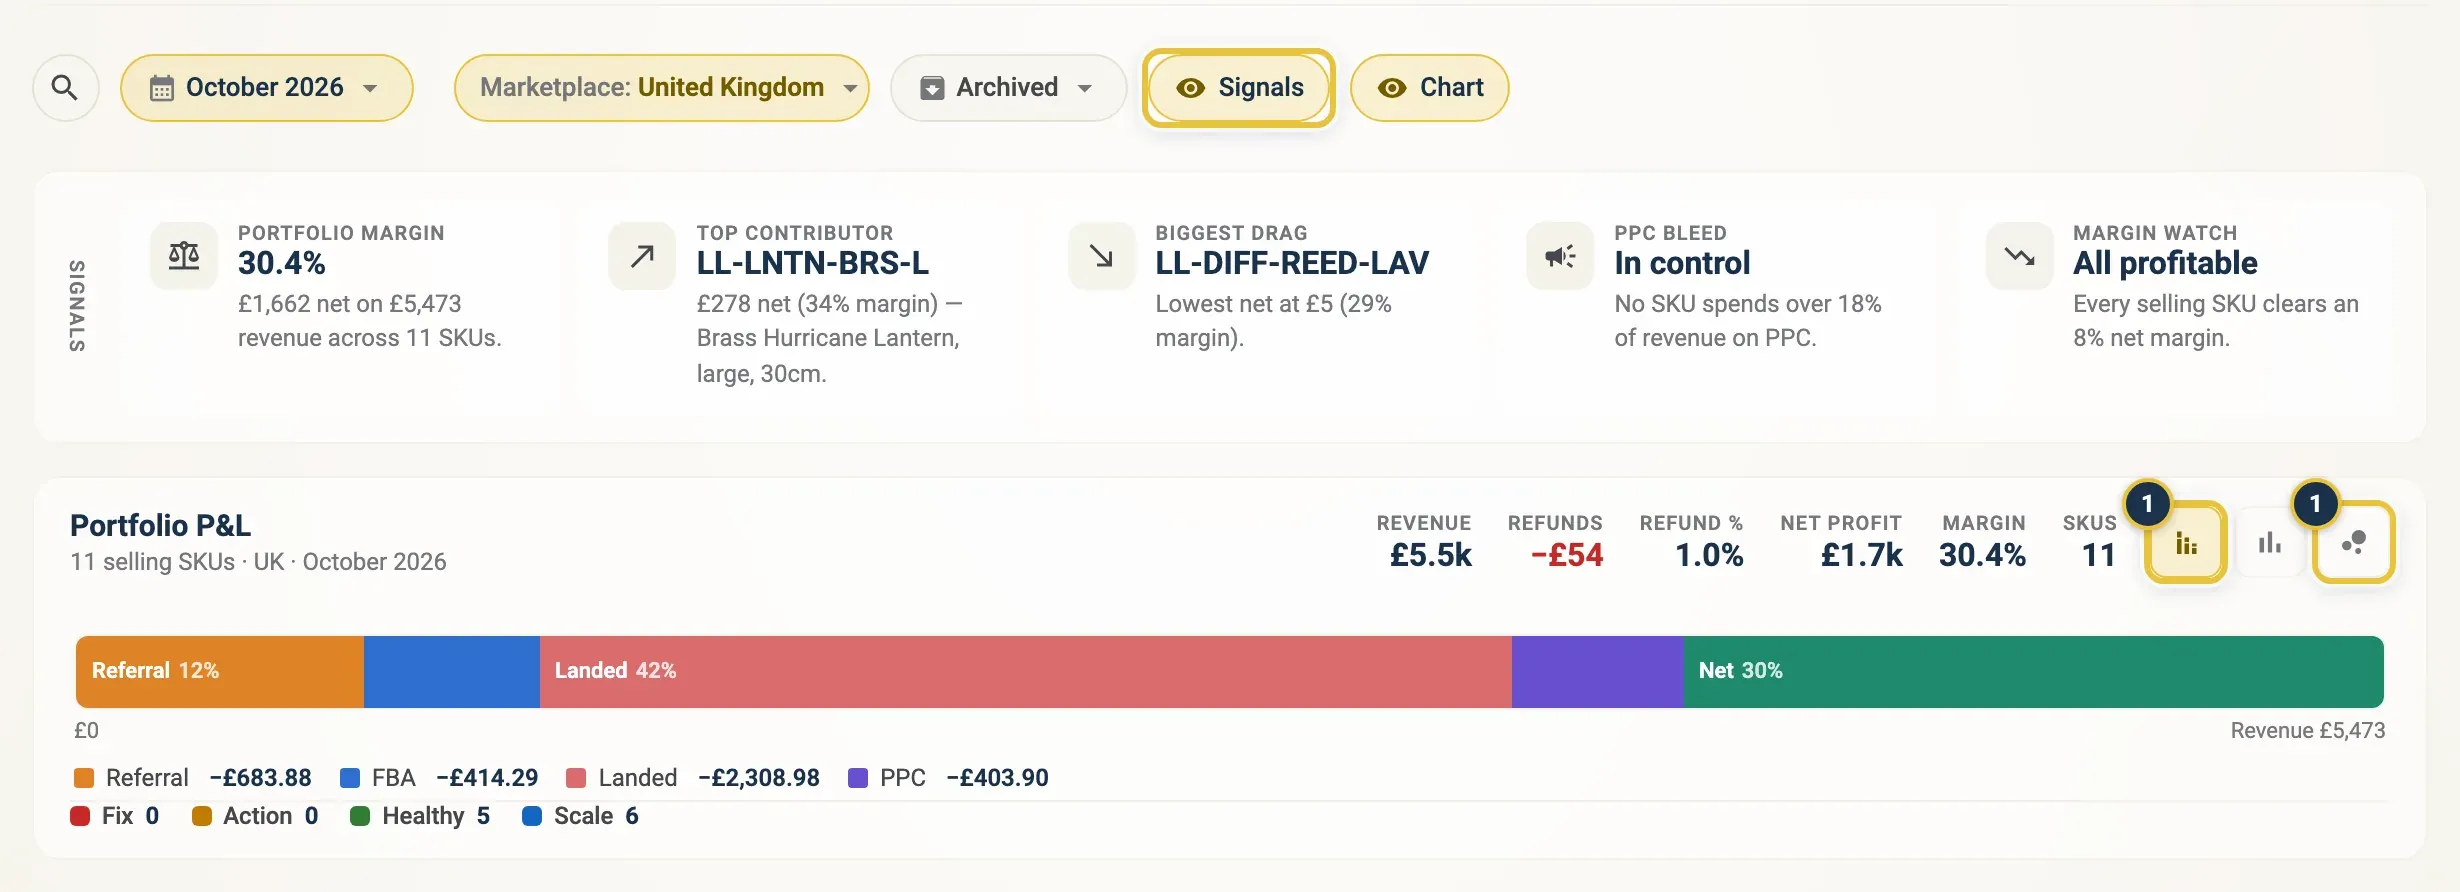
The Signals strip, and the Portfolio P&L with its view buttons (1). Start here shows under the bar only when there are problem SKUs.
Understand the SKU status (Fix, Action, Scale, Healthy)
Section titled “Understand the SKU status (Fix, Action, Scale, Healthy)”Every SKU in the SKU Profitability table gets one status in the Status column. The first rule that matches wins:
- Fix: the SKU loses money (net profit is zero or below).
- Action: the SKU makes a profit but has a problem: high refunds (10% of sales or more), PPC bleed (ads are 18% of revenue or more), overstock (storage is 8% of revenue or more), or a thin net margin (under 8%).
- Scale: a strong net margin (22% or more) with healthy volume (at least 12 units). Consider more stock and ads.
- Healthy: performing within a normal band, or no sales this month.
See one SKU’s cost breakdown
Section titled “See one SKU’s cost breakdown”- In the SKU Profitability table, click a row.
- The side panel shows units sold, revenue, net profit and net margin, then the cost breakdown: referral fee, FBA fee, refunds, landed cost (COGS), PPC spend and storage fee, with profit per unit.
- Use the arrows at the top of the panel to move to the previous or next SKU.
- Use Note at the bottom to keep context for the SKU, such as a price change, and click Save note.
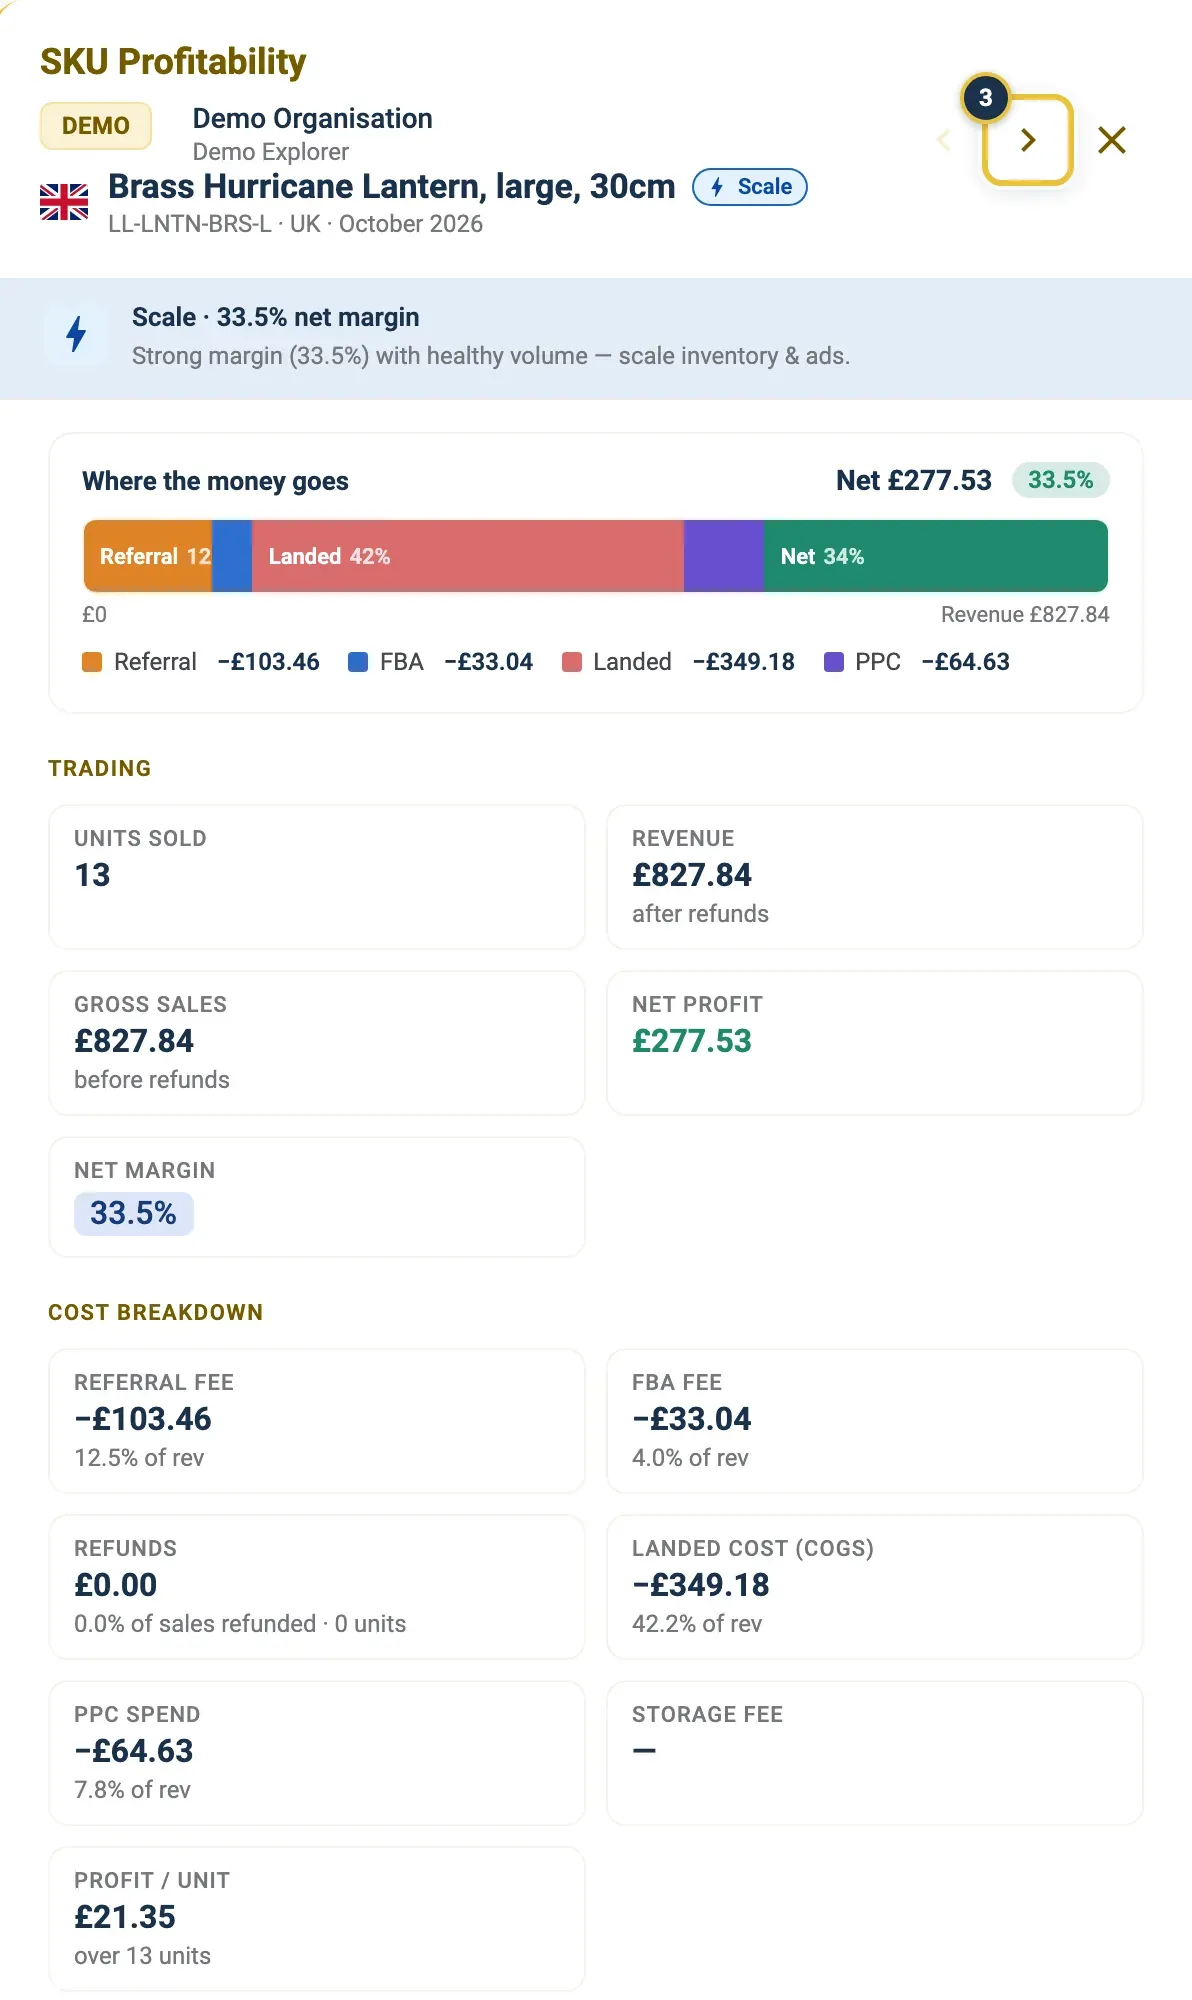
One SKU with its status advice, Where the money goes and the cost breakdown. The arrows (3) move to the next SKU.
You can also search the table with Search SKU or product… and sort it by clicking a column heading.
Good to know
Section titled “Good to know”- Archived products are hidden. Use the Archived chip, or the show link above the table, to include them.
- For some older months, refunds were not imported, so refund figures show “—” and do not count towards the status.
- SKUs appear once Amazon has settled sales for them. If a SKU has no landed cost yet, add it in SKU Margins.
- For the whole month as a statement, see the Profit and Loss report.